Dashboard Overview
Enterprise Infrastructure (ITS-EI) provides a server dashboard to view information about servers hosted and managed by ITS-EI. This includes servers using any of the following services: Core Application Services (CAS), Specialized Application Services (SAS), and Co-Managed (hybrid) Application Services services.
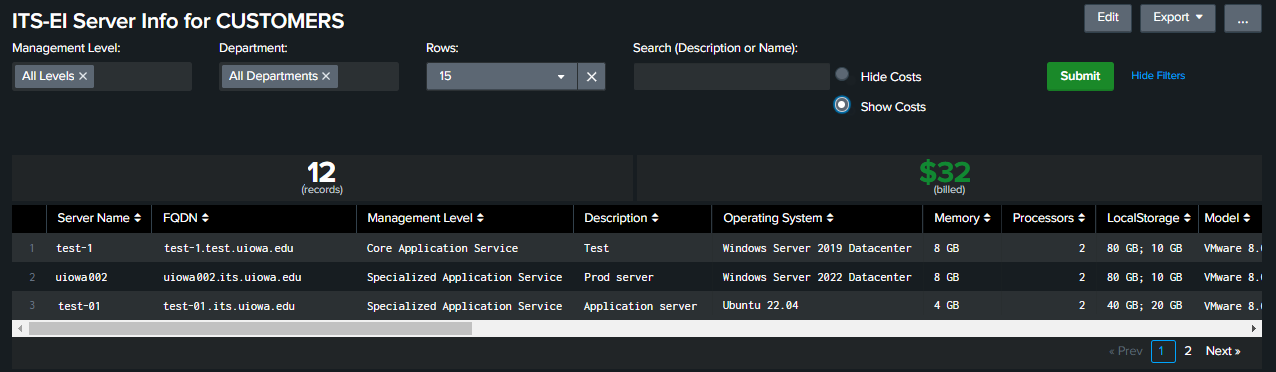
The data contained in the dashboard is pulled from different sources and presented in a single pane of glass. Below is a picture of the main dashboard screen where you will be able to view a variety of managed systems.
Accessing
Access to the dashboard is allowed to members of the domain group Iowa\OneIT-Staff and can be allowed to others as needed. Login to view is HawkID enabled.
Filtering
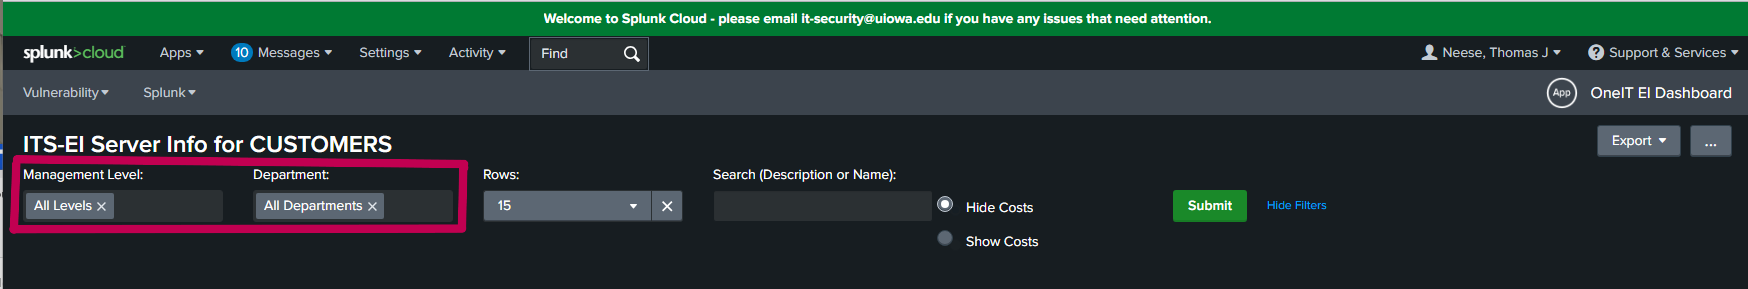
In order to filter the dashboard results, there are 2 main filters. Click within either of the filter boxes to see a list of the filtered values. Select 1 or more desired values and click the green "Submit" button. When adjusting the filters, remember to remove filters (click the x) no longer needed.
- Management Levels
- Co-Managed - systems where both EI and the associated department manage the system
- Core Application Service - systems managed by Managed Application Services Core team
- Specialized Application Services - systems managed by Managed Application Services Flexible team
- TPS-Managed Data - systems managed by Technology Platform Services Data & Monitoring team
- Department
- Listing of departments as identified within EI's inventory system
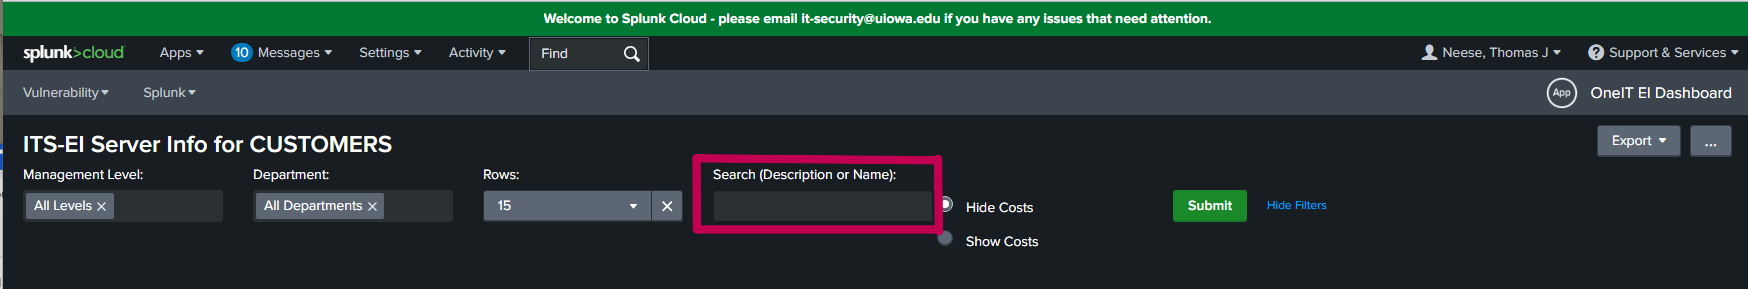
Searching
To search for a specific system by host name or description, click in the Search box and type your desired search values and click the green "Submit" button.
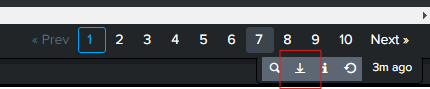
Exporting
Steps to export the dashboard data:
- Filter the list of systems to your desired subset of systems
- Move mouse to the lower right-hand corner of the display table
- Select the "download" arrow from the pop-up menu and choose where to save your data
Cost information
The cost for the server is also displayed on the dashboard and allows you to see more details of the server costs by selecting the "show costs" radio button and then clicking the green Submit button. The displayed costs are from our ITConnect billing system.